[Suomeksi]
International Organization for Standardization (ISO) rejected
the fast-track approval of the controversial
Microsoft-supported OOXML document format as an ISO standard
in a vote
on 2 September 2007.
During the voting process the reputation of ISO as a dependable
technical standardization organization was questioned.
For example, in Sweden a Microsoft representative
was
caught offering to recompense partners for voting yes to OOXML.
Also a
sudden interest from
countries like Ivory Coast
to the OOXML issue has
been found suspicious.
We studied the relation between the corruption level
and voting behaviours of the countries.
We found that more corrupted the country is, the more likely it was to vote for
the unreserved acceptance of the OOXML standard proposal.
We used the [Transparency
International‘s] 2006
CPI index
(Corruption Perceptions Index) as a measure of corruption. CPI index is a number between 1 and 10. A small CPI index means that the country is perceived to be very corrupted, while a large CPI index means that the country is perceived to have little corruption. Haiti has the smallest CPI index of 1.8, while the countries perceived having the least amount of corruption (Finland, Iceland, New Zealand) have a CPI index of 9.7. In barplots below the CPI index has been rounded down to the closest integer value.
ISO received a total of 87 votes, of which 70 was given either by the Secretariat country (USA), participating members (“P Member”) or observers (“O Member”); in the graph below only these 70 votes are shown. The votes are counted
according to the
complicated voting rules of ISO. The remaining 17 countries – most of
which are perceived to be relatively corrupted (median CPI index 3.0) – mostly supported the OOXML (approval 13, approval with comments 2, abstention 2, disapproval 0).
Is this just a random coincidence?
The median of the CPI index of the above mentioned 70 countries is 3.95.
Of the most corrupted half (CPI index less than 3.95)
23 or 77% voted for approval (approval or approval with comments) and 7 or 23% for
disapproval; 5 abstained.
Of the least corrupted half (CPI index more than 3.95)
13 or 54% voted for approval and 11 or 46% voted for disapproval; 11 abstained – see the table below.
This statistics supports with a P value of 0.073 the hypothesis that the corrupted countries were more likely to vote for approval (one-tailed Fisher’s Exact Test; two-tailed test would give
a P value of 0.092).
In other words: if the probability of an approval vote would be independent
of the corruption level of the country, the probability of
a positive correlation of at least the observed magnitude
would be about 7%.
| Lots of corruption | Little corruption | |
|---|---|---|
| Approval | 23 | 13 |
| Disapproval | 7 | 11 |
One should be careful in interpreting the result, though.
For example, the statistical test does not naturally tell anything about the reason
of the relation between corruption level and voting behaviour of a country;
in any case, whatever the reason for the correlation,
also some quite uncorrupted countries voted
for the approval.
And although the trend is interesting and the results informative,
the [above] conclusion is still not particularly
strong due to a relatively small number
of voting countries [for a stronger statistical result with
a P value of 0.019 see the following 6 September addition:].
Added 6 September 2007:
In hindsight, a natural choice for the statistical test would have been
the Wilcoxon Rank Sum Test. It is more powerful than the test described above
and it in fact gives stronger results:
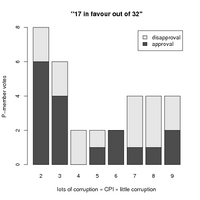
The OOXML standard failed to pass, because only 17 (53%) out of 32 P-members were in favour of the standard (66.6% would have been required); and
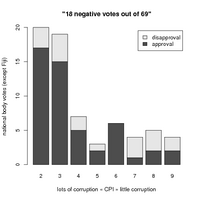
because 18 (26%) out of 69
national body votes were negative (at most 25% would have been allowed).
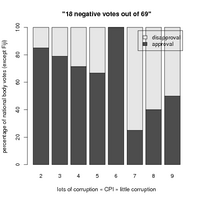
The countries which are perceived to be more corrupt were more likely
to vote for the approval than the countries
perceived less corrupt (P value of 0.085 in the P-member vote, P value of 0.019 in the national body vote, using
Wilcoxon Rank Sum Test; Fiji has been excluded because it has no CPI index) – see the figures
of the votes.
Added 12 September 2007:
A question raised, for example, in NOOOXML.org discussion about this article, was whether the new P-members were more likely to vote for approval.
According to
Groklaw, there were total of 11 new P signups
(Ivory Coast, Cyprus, Ecuador, Jamaica, Lebanon, Malta, Pakistan, Trinidad and Tobago, Turkey, Uruguay and Venezuela)
of which 9 voted for approval or approval with comments, 1 (Ecuador) for disapproval and 1 (Trinidad and Tobago) abstained. Summarizing, in the P-member vote
the votes were divided accross new and old members as follows:
| New P-member | Old P-member | |
|---|---|---|
| Approval | 9 (90%) | 8 (36%) |
| Disapproval | 1 (10%) | 14 (64%) |
We can conclude that the new P-members were more likely to vote for approval than the old P-members (90% vs. 36% respectively, P value of 0.0073, Fisher’s Exact Test).
There has been lots of discussion of the meaning of the results. The fact is that of the countries perceived more corrupt larger fraction voted for OOXML, and of the countries perceived less corrupt smaller fraction voted for OOXML. We can also state with a reasonable confidence that the countries perceived more corrupt were indeed more likely to vote for the OOXML than the less corrupt.
Similarly, we can conclude with a reasonable confidence that the new P-members were indeed more likely to vote for the approval of the OOXML than the old P-members.
As stated above, the statistics alone do not reveal the reason for the correlations. However, the observed correlation cannot be dismissed because the reason for it is more difficult to establish than the correlation itself. To find the reasons one should look behind the numbers: for example, why did countries like Ivory Coast find a sudden interest to ISO standards? Was what happened in Sweden just an isolated incident? What about other oddities? Even without CPI indices the issues raised elsewhere should be enough for the ISO and many national standards organizations to seriously re-examine the integrity their decision making processes.
[5 September 2007: the interpretation of P value was corrected and comments of significance added; corrected comment on voting process
(also the votes of non-members are counted in one part of the voting process);
added some links to the text.]
Additional information
- Piilotetut
kortit eivät sovi yhteen avoimien standardien kanssa (Effi
16.8.2007) [in Finnish] - Live-bloggausta
SFS:n OOXML-kokouksesta (Ville Oksanen 20.8.2007) [in Finnish] - OOXML ei mennyt suoraan läpi ISO:ssa (Ville Oksanen 4.9.2007) [in Finnish]
- Lehdistötiedote:
Äänestystulos punnitsee Microsoftin lupausten arvon (Effi
4.9.2007) [in Finnish] - NoOOXML
- Groklaw ODF/MS OOXML PAGE
What is Effi?
Electronic Frontier Finland ry (Effi) was founded in 2001 to defend active users and citizens of the Finnish society in the electronic frontier. Effi influences legislative proposals concerning
for example personal privacy, freedom of speech and user rights in copyright law. We make statements, press releases and participate actively in actual public policy and legal discussion. Effi also works in close cooperation with organizations sharing same goals and values in the Europe, United States and elsewhere. Effi is a founding member of the European Digital Rights (EDRi).
The members of the board and many active members are experts in the fields of law and technology. Many of us do University-level research on these matters.
[Added 6 September 2007:]
Appendix: For the technically inclined
The data set is relatively easy to study using the attached CSV file of the voting results and
CPI indices. Using freely available R,
the Wilcoxon Rank Sum Test yielding a P value of 0.019 can for example be obtained
as follows:
 # Read in the data table:
 B <- read.csv("http://www.effi.org//wp-content/uploads/ooballot_0.txt")
 # CPI indices of the countries that voted for approval:
 capp <- B[!is.na(B[,"CPI"]) & (B[,"Vote"]=="Approval" |
                                B[,"Vote"]=="Approval with comments"),"CPI"]
 # CPI indices of the countries that voted for disapproval:
 cdis <- B[!is.na(B[,"CPI"]) & B[,"Vote"]=="Disapproval","CPI"]
 # Is there a relation between the CPI index and voting behaviour of a country?
 wilcox.test(capp,cdis)
 #     W = 281.5, p-value = 0.01944
 # Make a nice figure of the result, containing votes of all national bodies
 # (except Fiji which has no CPI index):
 x <- matrix(c(table(factor(floor(capp),levels=2:9)),
               table(factor(floor(cdis),levels=2:9))),
             nrow=2,ncol=8,byrow=TRUE,
             dimnames=list(c("approval","disapproval"),2:9))
 barplot(x,
         main='"18 negative votes out of 69"',
         xlab="lots of corruption « CPI » little corruption",
         ylab="national body votes (except Fiji)",
         legend.text=c("approval","disapproval"))
It is easy to see from the
resulting figure
that the countries which are perceived to be more corrupt were indeed more likely
to vote for the approval of the proposed OOXML standard than the countries
perceived less corrupt, the observation which is also confirmed by the statistical test.
This document and attached images are Public Domain.